

NASA has unveiled the initial maps generated by its groundbreaking space-based pollution instrument, TEMPO (Tropospheric Emissions: Monitoring of Pollution). These maps shed light on pollution distribution across North America, offering a valuable tool for scientists to comprehensively analyze air quality on an hourly basis. While the data confirms higher pollution rates in urban areas, the instrument’s capabilities extend to monitoring pollutants at a neighborhood level, providing crucial insights into health and environmental impacts.
Launched in April and stationed 22,000 miles above the equator, TEMPO enables in-depth study of the effects of pollutants, such as those emanating from rush-hour traffic, forest fires, and agricultural activities. The instrument employs hourly measurements, unveiling the intricate interplay of various pollutants and their impact on different regions. By analyzing sunlight reflected from the Earth’s surface, atmosphere, and clouds, TEMPO determines concentrations of gases, including nitrogen dioxide, a common indicator of pollution levels.
NASA Administrator Bill Nelson emphasized the significance of TEMPO’s data for communities across the nation. “Neighborhoods and communities across the country will benefit from TEMPO’s game-changing data for decades to come,” Nelson stated in a press release. The data garnered from TEMPO is expected to contribute significantly to NASA’s efforts to meet the climate goals set by the Biden administration.
The information gleaned from TEMPO will be shared with partner agencies, including the Environmental Protection Agency (EPA) and the National Oceanic and Atmospheric Administration (NOAA). Since its initial measurements earlier this month, the instrument’s systems have undergone rigorous checks and calibration in preparation for regular hourly operations, which are scheduled to commence in October.
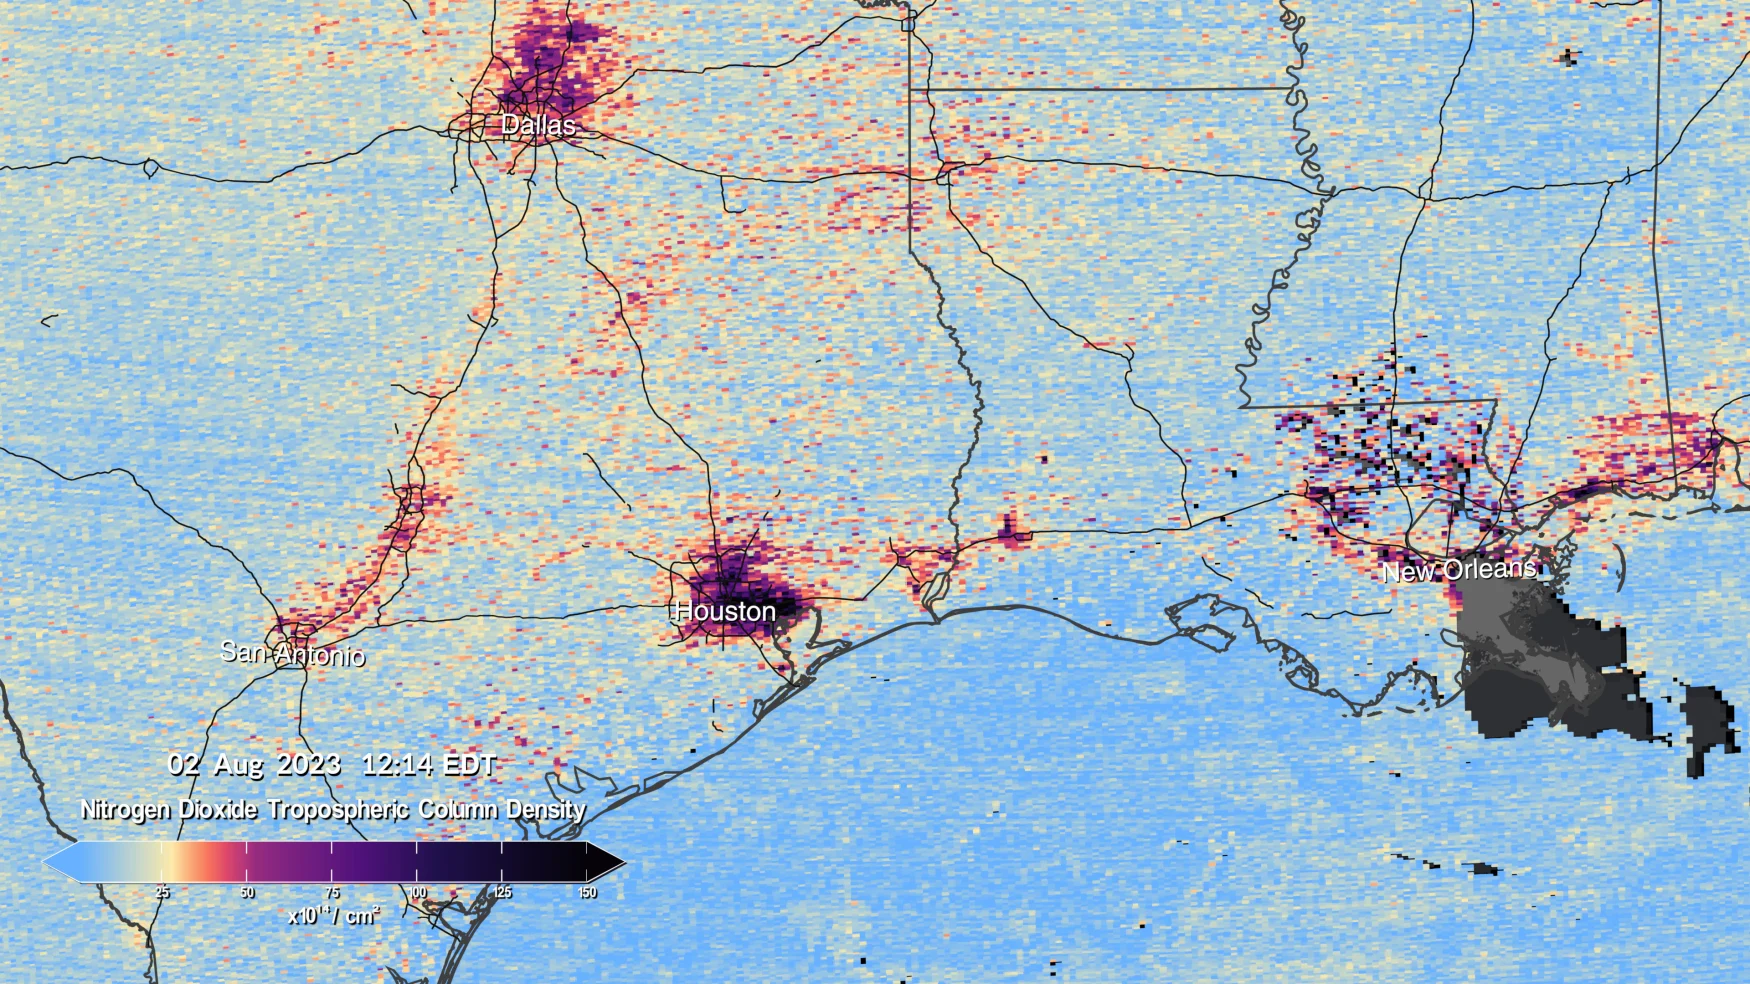
The instrument’s debut images, released on August 2nd, captured the I-95 corridor in the Northeast, showcasing cities like New York, Philadelphia, and Washington, DC. The maps also depicted the southern region from central Texas to New Orleans and a section of the Southwest spanning from Los Angeles to Las Vegas. These visuals highlighted the prevalence of nitrogen dioxide density over urban centers and their suburban extensions.
As NASA detailed, the maps reveal dynamic patterns of nitrogen dioxide concentrations. In the mornings, high levels of nitrogen dioxide are evident over cities, dissipating as the day progresses. However, the evening marks the onset of the second rush hour, causing a resurgence in nitrogen dioxide levels over metropolitan areas.
In light of recent events, such as widespread exposure to forest fire smoke during the summer, NASA emphasizes the instrumental role of TEMPO in enhancing public accessibility to air quality data. By making TEMPO data available and user-friendly, NASA aims to empower individuals and decision-makers to contribute to air quality monitoring and improvement efforts, ultimately benefiting the well-being of both society and the environment.